Tuesday, May 16, 2017

Cabela's Retail Site Selection

Retail Site Selection for Cabelas's


Presented to:
Cabela's 


Prepared by:

Ian Beal
University of Wisconsin Eau-Claire


Overview:
Cabela's is a popular sporting goods store for many people around the United States.  It sells a wide variety of products from hunting clothes and boats, to cooking supplies and camping equipment.  Cabela's is known for their extravagant stores that often feature hundreds of head-mounts and sometimes large aquariums.

LocationPro LLC has been hired to find a new location for a Cabela's in Waukesha County Wisconsin.  Cabela's believes they are missing a section of the market to the west of Milwaukee and would like to put in a new store location.  Location is very important for customers when deciding what outdoor store to purchase their goods at.  Most outdoors stores sell the same brand products for the same price.  This means it is imperative that the store is in the proper location to get people in their store and not their competitors.  Esri's Business Analyst will be used to analyze customer demographics, trade areas, market structure, a gravity model, and to create a rank of the most suitable locations for the new store.

Methods:

Demographics:

It is important to understand that Cabela's has a great reputation and many people prefer to shop there instead of other sporting goods stores such as Gander Mountain.  Being located close to another sporting goods store is not a deal breaker.  It is more important that the proper target market is found and that a store can be located in that area. The best store location was calculated using the following population parameters:


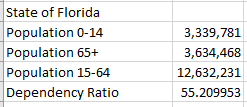
  • 2016 Total Population
  • 2016 Total Households
  • 2016 Household Income $75,000 - $99,000
  • 2016 Household Income $100,000 - $149,000

This generalization of customers will produce areas that have a high amount of population and that have a high amount of income.  This will result in areas that can be very lucrative for business.  Having a store in an area that has a large amount of people that have extra money to spend on recreational activities is good for business.  Many people do not have extra money and time to spend on outdoor activities.  People who make more than $75,000 a year are likely to have a job that allows them enough vacation time to go on extravagant hunting trips, hiking trips and other vacations that will require supplies from Cabela's.  A store that is located near lots of people who make more than $75,000 will experience good sales numbers.  These demographics were used in order to rank 3 possibly sites for a new Cabela's in Waukesha County.

Rank Sites:
Figure 1: Ranked Sites
 3 Possible Locations were selected based on the area available, and if a new building could be built on the land there.  These possible locations were entered into Business analyst and a site ranking tool was ran.  This tool look into account the total population, total households, and household income from $75,000 to $150,000 in a two mile radius around the possible sites.  It then ran a formula that determined the best spot out of these three locations.  The algorithm determined that the middle location was the best spot.

Trade Areas:

To further understand if the ranked sites are actually the best location for the new store, a drive times  map was made to show the area that is within a half hour drive of the new locations.  Because the stores are located near another, only one store was used to show the drive time.  The whole Milwaukee area is located within a half hour drive of the possible locations.

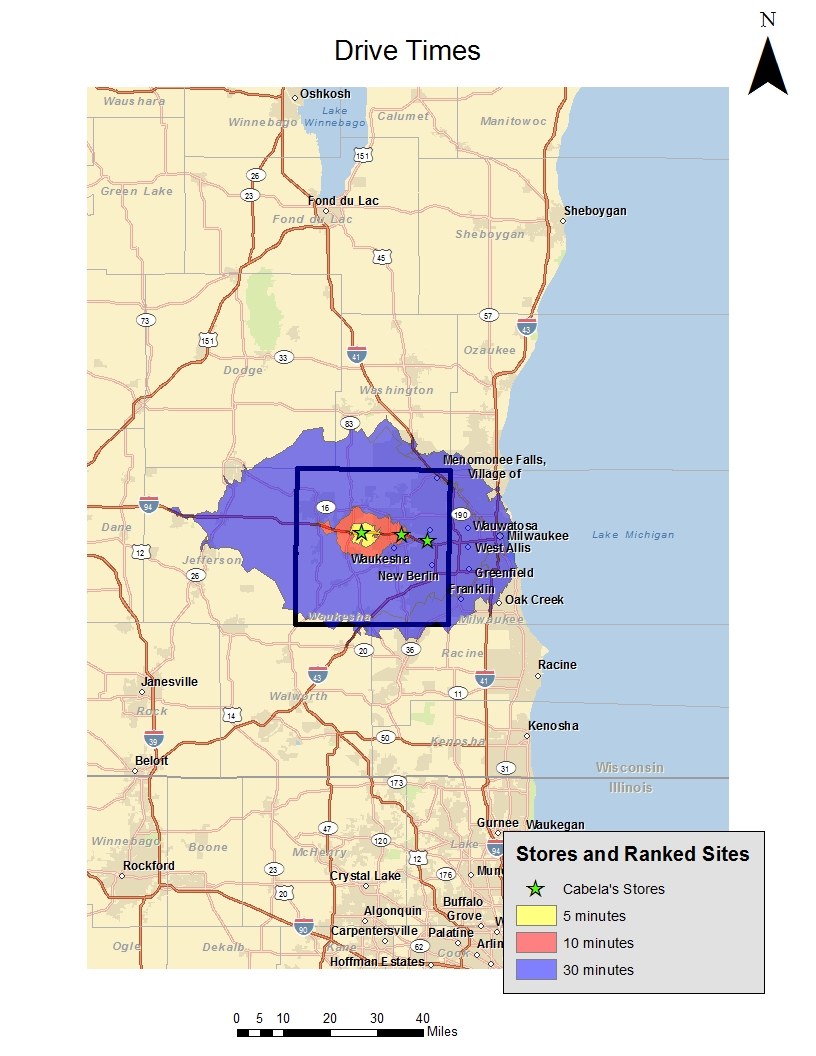
Figure 2: Drive Times
Each site is located within close proximity to a highway and that allows for easy access to all the surrounding area.  Nearly all of Waukesha County and more is within a half hour of the sites.

Market Structure:

Cabela's is a powerhouse sporting goods retailer that has few competitors that can shelf as many products and provide as many services as they do.  Gander Mountain is one of the main stores that compete with them.  It is well known that Gander Mountain is struggling financially and just got bought out by a Camping retailer.  The map below shows where the only Gander Mountain in Waukesha County and its proximity to the potential new Cabela's location.

Figure 3: Market Structure

Gravity Model/ Point of Indifference:

The gravity model or point of indifference is a formula that helps determine what store or place people will go to shop if they are from a certain area.
Figure 4: Gravity Model

In this formula:
d = distance on a major highway from city A to B
Pb = population of city B
Pa = population of city A
this is set to equal:
Dab = the breaking point from city A, measured in miles along the road to city B

The three cities to be examined using this model are: Milwaukee, Mukwonago, and Oconomowoc.
The breaking points for these cities to Waukesha were:

Mukwonago: 9.9 Miles
Milwaukee: 5.1 Miles
Oconomowoc: 14.5 Miles

This means people who reside in these cities are likely to shop in within that distance of the city they live in.  This is where the point of indifference comes into play.  Cabela's is a store that people people are willing to travel outside their typical area to shop.  Just because they are not within that distance of Cabela's does not mean they will not shop there. 

Conclusion:
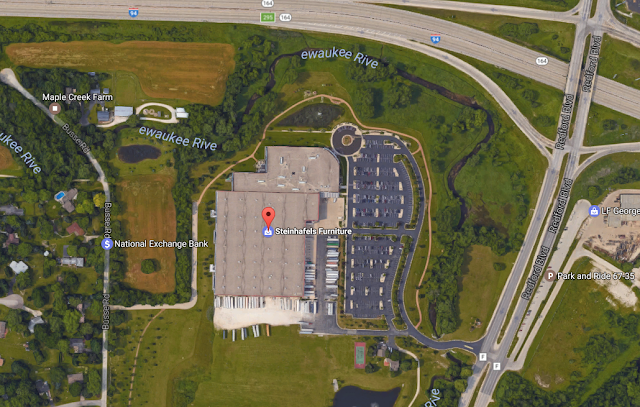
Looking back at the Ranked Sites map (figure 1) the best location for a new Cabela's would be where a Steinhafels is currently located.  It would be very expensive to buy out a company that has been there for a long time and owns a very good location. Cabela's often builds their own buildings and that is what would be recommended in this situation.

Site 2 from the Ranked Sites map is a field that is located slightly further west.  This is not a big deal because the interstate runs right up to it and allows for Cabela's to build their own structure.


All of the data from demographic, market analysis, and location data indicates that this location would be a good spot to locate a new Cabela's.  This location is within a half hour for all of Milwaukee and the surrounding area.  It would be grabbing a whole group of customers that previously had to drive far north of Milwaukee to reach the closest Cabela's.  This would also bring in customers from the south and to the west that currently do not have access to a great sporting goods store like Cabela's.   

Tuesday, April 25, 2017

Trader Joe's Retail Site Selection

Retail Site Selection for Trader Joe's


Presented to:
Trader Joe's 


Prepared by:

Ian Beal
University of Wisconsin Eau-Claire


Overview:

Trader Joe's is a for profit company looking to open up a new store in the Minneapolis Minnesota area.  They want the customer data from Hennepin and Ramsey counties to analyzed in order to find the best spot for a new store.  They believe this data could provide the information for the best location for a new store.  Business Analyst will be used to run multiple tests to determine the best spot for the new store.  

Process:

To begin the process of finding a new store location the existing stores were created into a map along with the area being examined. The new store will be located within Hennepin and Ramsey Counties.  The black area in the map below (figure 1) represents the two counties merged together into one study area.  This is the area all of the data will be taken from.  

Figure 1


Trader Joe's provided customer information from the area.  This is a valuable resource when finding the best location for a new store.  Figure 2 shows the store locations and where all the customers are located.  

Figure 2
Business Analyst allows for ideal customer locations to be located based off parameters entered.  This creates zones that identify the best areas based off the parameters.  Figure 3 identifies the zip codes within the study area that have the highest average population and the highest average household income.  This allows for the most ideal customers to be located.  The most ideal customers are within the areas that are green in the map below.  This is crucial for finding the best location for the new store.  A store that is nearest these areas will produce the most customers and revenue.  Business Analyst allows for the user to easily find the mean center of all the customers.  This is represented in figure 3 by the large yellow circle. Figure 3 shows that there are stores currently located in some of the areas with ideal customers.
Figure 3
To find where the current store locations are best reaching the current customers a market penetration report can be ran.  Market penetration takes the customers in each zip code and divides this by the total population of that area.  After this was done a map (figure 4) was created to show the areas that are being utilized the best by the current store.  The areas that are lighter green are areas that could be targeted better to get them into the store.  These areas are also spots that could be targeted for the new store location.
Figure 4
Figure 5 is a graph that was created by the market penetration report.  It is a bar graph of the percent of population that is currently customers and what areas they are in. 

Figure 5
To find new possible store locations the market penetration map (figure 4) and the ideal customer locations map (figure 3) were utilized.  With these maps in consideration, google maps was used to find a building in a suitable area that could be used for a new store.  The buildings chose were located near the ideal customers and in areas where there are already known customers.  These buildings were geocoded then added into Business Analyst.  The map below (figure 6) shows the possible new locations marked by a red star.

Figure 6


To find the best possible location for a new store the 3 potential new store locations were ranked by a set of data that could determine the highest amount of customers.  These variables were: 2016 Total income, 2016 median household income, individual average spent per week by a household at food stores of $150 or more, and customers who have shopped at a Trader Joe's for more than 6 months.  Business Analyst then ranked the 3 possible locations from best to worst.  Figure 7 shows that the possible possible location south of Maple Grove has the best chance of being successful based off those parameters. 
Figure 7
Conclusion:

Business Analyst is a powerful tool that allowed for customer and population data to be used in finding the best location for a new Trader Joe's in the Minneapolis, St. Paul area.  A variety of tools were ran in BA, Market Penetration, Mean Center, Locate Ideal Customers, and Ranking Sites.  These tools provided the information needed to find the best location for a new store.  Beyond just the information that BA provided, the location of store number one is in between two wealthy areas of the twin cities.  Maple Grove and Minnetonka contain demographics that are favorable to be Trader Joe's customers.  The locations provide a template to find a building in that area that is for sale and can be turned into the most profitable Trader Joe's in the area.  The information is provided now it is up to Trader Joe's to make a decision based on the information they have.     


Wednesday, April 5, 2017

Real Estate Analysis

Introduction
We will be conducting an analysis that portrays a home and its features and then attempt to “sell” this home after addressing all of these unique characteristics. The home that we will be attempting to sell resides in the Third Ward neighborhood in Eau Claire, WI. Throughout our analysis we will identify a fair-market value for the home as well as an ideal consumer market for this type of home.


In order to come up with these conclusions, the analysis will cover the following:
  • The unique features/characteristics of the home
  • Address prices of similar houses in the same area
  • Compare the home with other similar homes
  • How its location in the third ward affects its value
  • Potential for growth and how it affects the value of the home


We will be using a series of various websites and databases to obtain data regarding the home we are “selling” as well as other comes in comparison. These sources include but are not limited to: Zillow, City of Eau Claire Property Search, Business Analyst, and Eau Claires Comprehensive Plan of 2015.


446 Mckinley Ave


  • 4 Beds
  • 1 Full Bath and 1 Half Bath
  • Constructed: 1950
  • Lot Size: 0.26 Acres


Basic Features
  • Fireplace included in living room
  • Flooring: Polished Maple Flooring
  • Attached 1 Car Garage
  • New Shingles (2009)


The listed home sits in a prime spot within the iconic Third Ward Neighborhood between UWEC campus and downtown. This home features many basic features as well as unique features that set it apart from similar homes in the same area.


Unique Features
  • Garden shed next to garage
  • Deck sits atop of garage with access
  • Siding professionally painted in 2011
  • Front door is protected by walk-in porch
  • Other Renovations
  • Spacious 11,325 sqft. lot
    • Furnace
    • Updated eat-in kitchen
    • Tiled bathroom


This house has many unique features and aspects that really make it a modern home despite being built in 1950. With the additions and renovations done to the home this home is a great setting for a small family looking to be planted in a home for a significant amount of time with easy access to schools K-12.


Demographics


The Third Ward is one of Eau Claires most well respected and documented neighborhoods for a multitude of reasons. First, there is a wide range of statistics that tend to mislead individuals ignorant to local geography. The percentage of rentable households is over 60 percent in the Third Ward compared to the city of Eau Claire which sits at 47 percent. (See Figure 1) One may think that the high rental percentage is due to a lack of opportunity in the area which would be wrong. The University of Wisconsin-Eau Claire proudly sits just west of the Third Ward (the university is partially in the third ward) which explains the neighborhoods high occupant turnaround and low-income resident percentage of 49.2.
Figure 1
Source: findthehome.com


Approximately over one third of the Third Ward has has been given a Bachelor's Degree. (See Figure 2) This is a glaring sign that the neighborhood see’s higher education as a premium. Granted, this statistic only takes into account individuals that are 25 and or older which doesn’t qualify the neighborhood as a whole. Although, as discussed previous, most lower income tenants in the Third Ward are students attempting to get their degree. When compared to the rest of the city of Eau Claire, the Third Ward more than doubles in it’s overall percentage of Bachelor’s Degree recipients.


Figure 2
Source: Findthehome.com


The large scale of incomes, home types, and lifestyles make the Third Ward one of Eau Claire’s most diverse neighborhoods. This diversity, especially in an economic sense, gives way to a variety of different businesses that will cater to your every need. There are more fitness centers, cafes, and more places for adults of all ages to enjoy a relaxing night out. The diverse population in the Third Ward paired with the low crime rate within the neighborhood (when compared to Eau Claire as a whole (see figure 3)) makes for a fantastic place to own a home. The map below shows all reported criminal activity within the selected study area since the beginning of 2017. Without question, the safest area in the downtown region is the Third Ward. Out of the 796 reported crimes committed in the City Of Eau Claire between January 1st, 2017 to March 31st, 2017; 13 happened within the Third Ward and none of them were violent crimes. This makes the Third Ward one of the most accessible, versatile, and safe locations within the City of Eau Claire. More on location below


Figure 3
Source: Crimemapping.com and Adobe Illustrator


Location
The Third Ward is tucked into a corner of downtown that has the hill to its back keeping traffic flow through the neighborhood to a minimum.  
thirdward.PNG
Figure 4
Source: City of Eau Claire Comprehensive Plan


Although the Third Ward is secluded, it is near many businesses and attractions that make it a great place to live.  The Third Ward is conveniently located within walking distance of downtown, UW-Eau Claire, and the water street area.  According to findthehome.com, 446 Mckinley is in a more walkable location that 72% of homes in the area.  
amenities.PNG
Figure 5
Source: Findthehome.com


There are many walking and biking trails that are located near the Third Ward. Putnam drive, located on the north eastern side of the third ward, turns into a walking/biking trail that extends around the Third Ward and onto the university's campus.  Along with the Putnam trail there is a playground and community garden within the neighborhood.  Dremmler garden is located on the north side of the Third Ward in Dremmler Park. There are 12 20’x20’ that can be rented for a season.


This house is located one mile away from an elementary school and two miles away from the local high school. The schools in the area are rated top 30% of schools in the state of wisconsin.  This is perfect for a young family looking for a new home.


Suggested Sale Price
$210,000


The asking price for this house was $209,000 and that is comparable to houses in the area.  This house sits on a corner lot and is the largest on the block.  With 4 beds and 2 baths this house is perfect for a young family looking for a starter home. It is in one of the nicest neighborhoods in downtown Eau Claire. The area this home is located in is comparably safe to the rest of the downtown area while still remaining close to a wide range of amenities for people of all ages. Schools closest to this home are all ranked within the top 30% of all of Wisconsin schools combined.Also with the additions and renovations that have been performed on the home the value has only gone up. With the updated kitchen to the tiling in the bathroom floor this home has really improved its interior appeal and would have no issues selling at this price. Not to mention the prospering housing market would help this home sell in no time.


Thursday, March 2, 2017

Assignment 2: Study Areas, Geocoding, Customers, and Trade Areas

Overview:
Two friends own separate coffee and doughnut shops in San Francisco and want to maximize their trade areas in order to benefit both businesses.  They want to make sure they are not taking each others business and want to know where they are in relation to other coffee and doughnut shops in the area.  They each have a few questions about local market. What is the market like for both stores? Are they competing for the same customers? Is one store in a better position than another? Who are their customers?  With the implementation of mapping these questions can be answered and visualized.

Methods:
To help the store owners understand who their customers are and where they come from four maps of the local San Francisco area were created.  The first map shows each store, its customers and the average customer location.  The second map shows the two stores, their customers, and competing coffee and doughnut shops in the area.  The third map shows the customer trade areas and the fourth map shows distance from each coffee shop.  The four maps are used together to understand who their customers and competitors are.

ESRI Business Analyst in ArcMap was the perfect platform to create these maps.  The first step was creating a study area.  This allows for the data to be localized to the San Francisco area as well as speed up the processing times.  Once the study area was defined, geocoded locations for the coffee shops and customers were imported into the software.  The next step was finding the average customer location for each of the shops.  The mean center tool was used in Arcmap to find this.  To further understand how each coffee shop fits into the local economy, all other competing coffee shops were added to the map.  This is where Business Analyst comes in handy.  A simple Add Business Listing search, allowed for other coffee shops in the area to be imported.  To further understand the customer dynamics of the area, a customer trade area was created.  This is a Business Analyst function that creates buffers around the coffee shops showing where 0-40%, 0-60%, and 0-80% of their customers come from.  Business Analyst also creates detailed reports for these trade areas.  The last step was to create a buffer around the stores with the drive and walking times.  This was done by creating a new trade area.  

Map 1

  Map 2
 Map 3


Map 4
Analysis:
At first glance it does not appear that store 1 and store 2 share much of the same customer base, this can be seen from looking at map 1.  To understand each of the stores customer areas, map 3 provides a useful visual. It can be seen that 80% of each of the stores customers do not overlap eliminating the question if the two stores compete against one another.  To further understand the customers in each of the trade areas, the trade areas report can be utilized.  From the report, store 1's customer trade area has a population of 136,356 and an average household salary of $116,235.  Store 2's trade area has a population of 160,009 and an average household income of $125,394.  That is important to know because it allows the store owner to know how many people it can potentially market to.  The next map that is important to look at is map 2, this provided spatial information on competing stores in the area.  It appears that store 1 is surrounded by many competitors, especially to its east.  Store 2 appears to be in a spot that is relatively void of competition compared to store 1.  The location of competitors is very valuable information to local business owners.  More competing stores in the vicinity, means more customers will go there instead of their coffee shop.  The fourth map shows that a large percent of each stores customers are located within a 1.5 mile radius of the stores.  A majority of customers do not want to travel far in order to get their coffee.   

Conclusions:
Store 2 is located in a better spot with less competition and more population.  The two stores are not competing for the same customers but store 1 has more competing coffee shops near it.  The market is similar for the customer bases of each store but store 2 has a customer trade area with almost 30,000 more people and its trade area has a higher average household income of $125,394 compared to $116,235.  With all the facts laid out, it is clear that store 2 is at an advantage in terms of its location, customer base, and lack of competition.  It can be expected that store 2 will see have more customers and do better business.  Store 1's customer base is located in a smaller area than store 2 and can utilize marketing to gain an advantage over the local competition.  Store 1 will have to work harder to gain customers because of all the competition in the surrounding area, lower population and a slightly lower average income per household.  


Wednesday, February 8, 2017

Project 1: Population Dynamics

Population Dynamics in Jacksonville Florida in 2015


Presented to:

Business Associates and Investors


Prepared By:

Ian Beal
Geography Study
University of Wisconsin Eau-Claire


Introduction

The opportunity has risen to invest a large amount of money in a new business in Jacksonville Florida.  Some of the investors believe there is a lot of potential in the growing youth population and other investors believe that catering to retirees could produce more profit.  A few other investors believe that focusing on the surge of Hispanic populations in the areas would be the most beneficial.  The purpose of this study is to break down the population dynamics of Jacksonville, Duval County, Florida as a whole, and the entire United States to determine which population would be fit to cater to the most.  This population data will be compared to the overall breakdown of the service industry and their sectors in the city of Jacksonville. 

Methods

Population data was retrieved for the year 2015 from the U.S. Census Bureau for the city of Jacksonville, Duval County, Florida, and the U.S., then manipulated in Excel in order to break down further into information that can be used.  The population data was broken up into age classes then the dependency ratio was calculated.  After the DR (dependency ratio) was calculated, the location quotient was calculated for too see how concentrated each population was in each area.  This resulted in a number around 1. More than 1 means the population is above average U.S. concentration and below 1 means less than average concentration.  The last step to determine where to invest money based off this data, is to compare it to economic characteristics in the area.  How many jobs are in what sector and how the population data relates to this. 

Findings

When looking specifically at the 0-14 population and the 65+ population, the population pyramid suggests that there is a larger 0-14 population than 65+ population.  This is supported by the raw data associated with the chart.

In the city of Jacksonville, there are over 60,000 more 0-14 year old's than 65+. When comparing this to the state of Florida it seems that this is unique to this area. 
The location quotient is the perfect data to use when looking at what populations are most prevalent in specific areas. 


The overall trend in the state of Florida is that there is a higher than average concentration of 65+ (1.32), Hispanic (1.38), and White (1.03) populations than the rest of the U.S.  This could be why some investors believe catering toward 65+ or Hispanic populations is smart but when examining the LQ of Jacksonville it can be seen that those categories are well below the average.  The LQ of Hispanics in Jacksonville is .5 which is half of the national average.  That puts catering towards the Hispanic population out of question.  The LQ for 65+ in Jacksonville is also below average at .86.  The only category to exceed national average is the 0-14 range.  This agrees with the population data and population pyramid from above.    

The next step is to look at the economic structure of Jacksonville to see how the population data fits into context at a business level.


The largest sector in Florida and Jacksonville is the education sector.  This makes sense because the growing youth dependent class.  The professional sector is the second largest and would be the next class to grow even larger because of the aging 0-14 population class.  The kids in the class will be educated into professionals in various fields.  

Conclusions

Based off a multitude of information, the growing youth population sector would be the best age group to target a new business towards in the Jacksonville area.  It is the largest dependent group and is continuing to grow.  A large population of people ages 15-64 supports this dependent group and can provides the means for them to do the things they want.  The 0-14 population is larger in Jacksonville than the national average with a location quotient of 1.02 and much larger than the average than the other dependent population groups in Jacksonville.  It would be a smart investment to direct a business towards the growing youth population in Jacksonville Florida.


Supplementary Data 


Jacksonville Data.


Florida Data


Sources